Ceilidh Charts
MikesCommunity's diary has been online since 2001 and in that time has amassed a lot of ceilidh data. So it might as well be put to good use to show how the frequency of ceilidhs has varied over time.
On this page you'll find various charts that show interesting statistics about the ceilidh scene. You could think of it as a ceilidh health check!
-
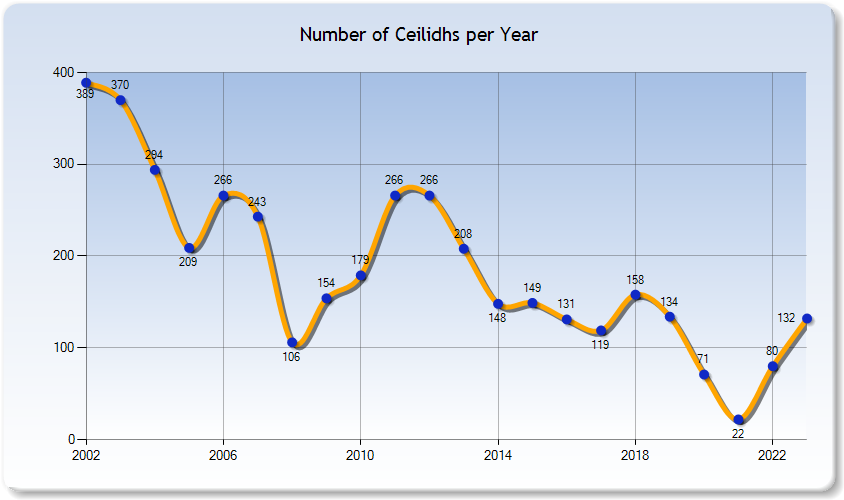
This first graph shows how the number of ceilidhs per year has been steadily dropping since 2002. I didn't include 2001 as the diary came online around April 2001 so there wasn't a full year of data. Likewise, it doesn't show the current year as it's not finished yet, so it's not meaningful to include it.
Note: there were periods when the site was offline for a while, for example in 2008, which explains the dip in the graph.
-
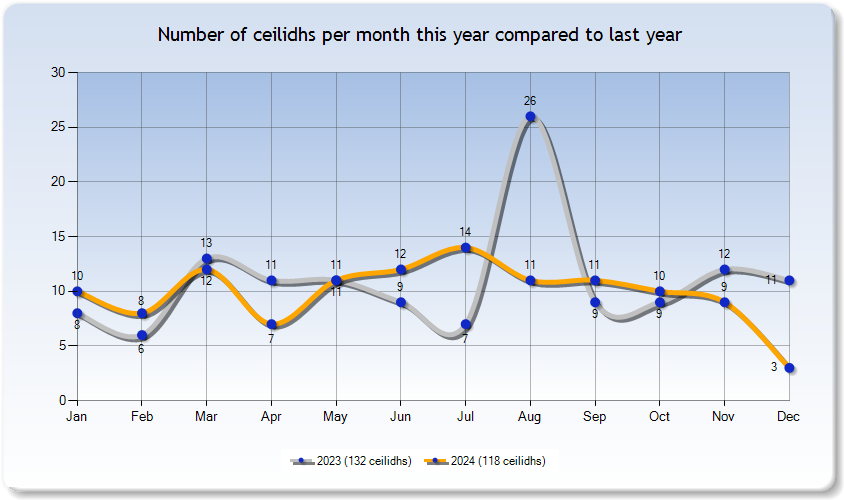
Here we have the number of ceilidhs per month for this year compared to last year.
Bear in mind that we've not got to the end of the year yet - more ceilidhs may appear between now and then.
More charts to follow. Watch this space...